
Hetzner is a truly great cloud provider based in Germany, with extremely competitive prices (we are talking a 7x cheaper than AWS / Google Cloud). Their customer support is in English and is extremely responsive and helpful (I'm not getting paid to say that).
Having an out-of-the-box Kubernetes installation can be a big hassle, on this article we will go over how to create your cluster using k3s – and how to set up monitoring.
All of this can be done in a couple of minutes!
k3s is a lightweight Kubernetes distribution developed by Rancher, and that completely implements the Kubernetes API.
Pricing comparison
For instance a cluster (3x CX41) with 12 vCPU and 48GB of RAM will cost you 48€ per month (around $54) on Hetzner Cloud. A similar cluster (3x t2.xlarge) would cost you on AWS 358€ per month (around $407) – of course you can get cheaper prices for reserved instance, but are comparing Apples to Apples.
In terms of dedicated servers, you can rent one that have a 8-core CPU, 64GB of memory for 40€ ($45) per month. You'd need to pay setup fees for dedicated servers – or get the setup fee waived if you get auctioned servers. If you're looking to have your servers in the US, they just opened up a datacenter in the US (Ashburn) for the same prices as in their German datacenter. (only for VM at the moment, not dedicated servers).
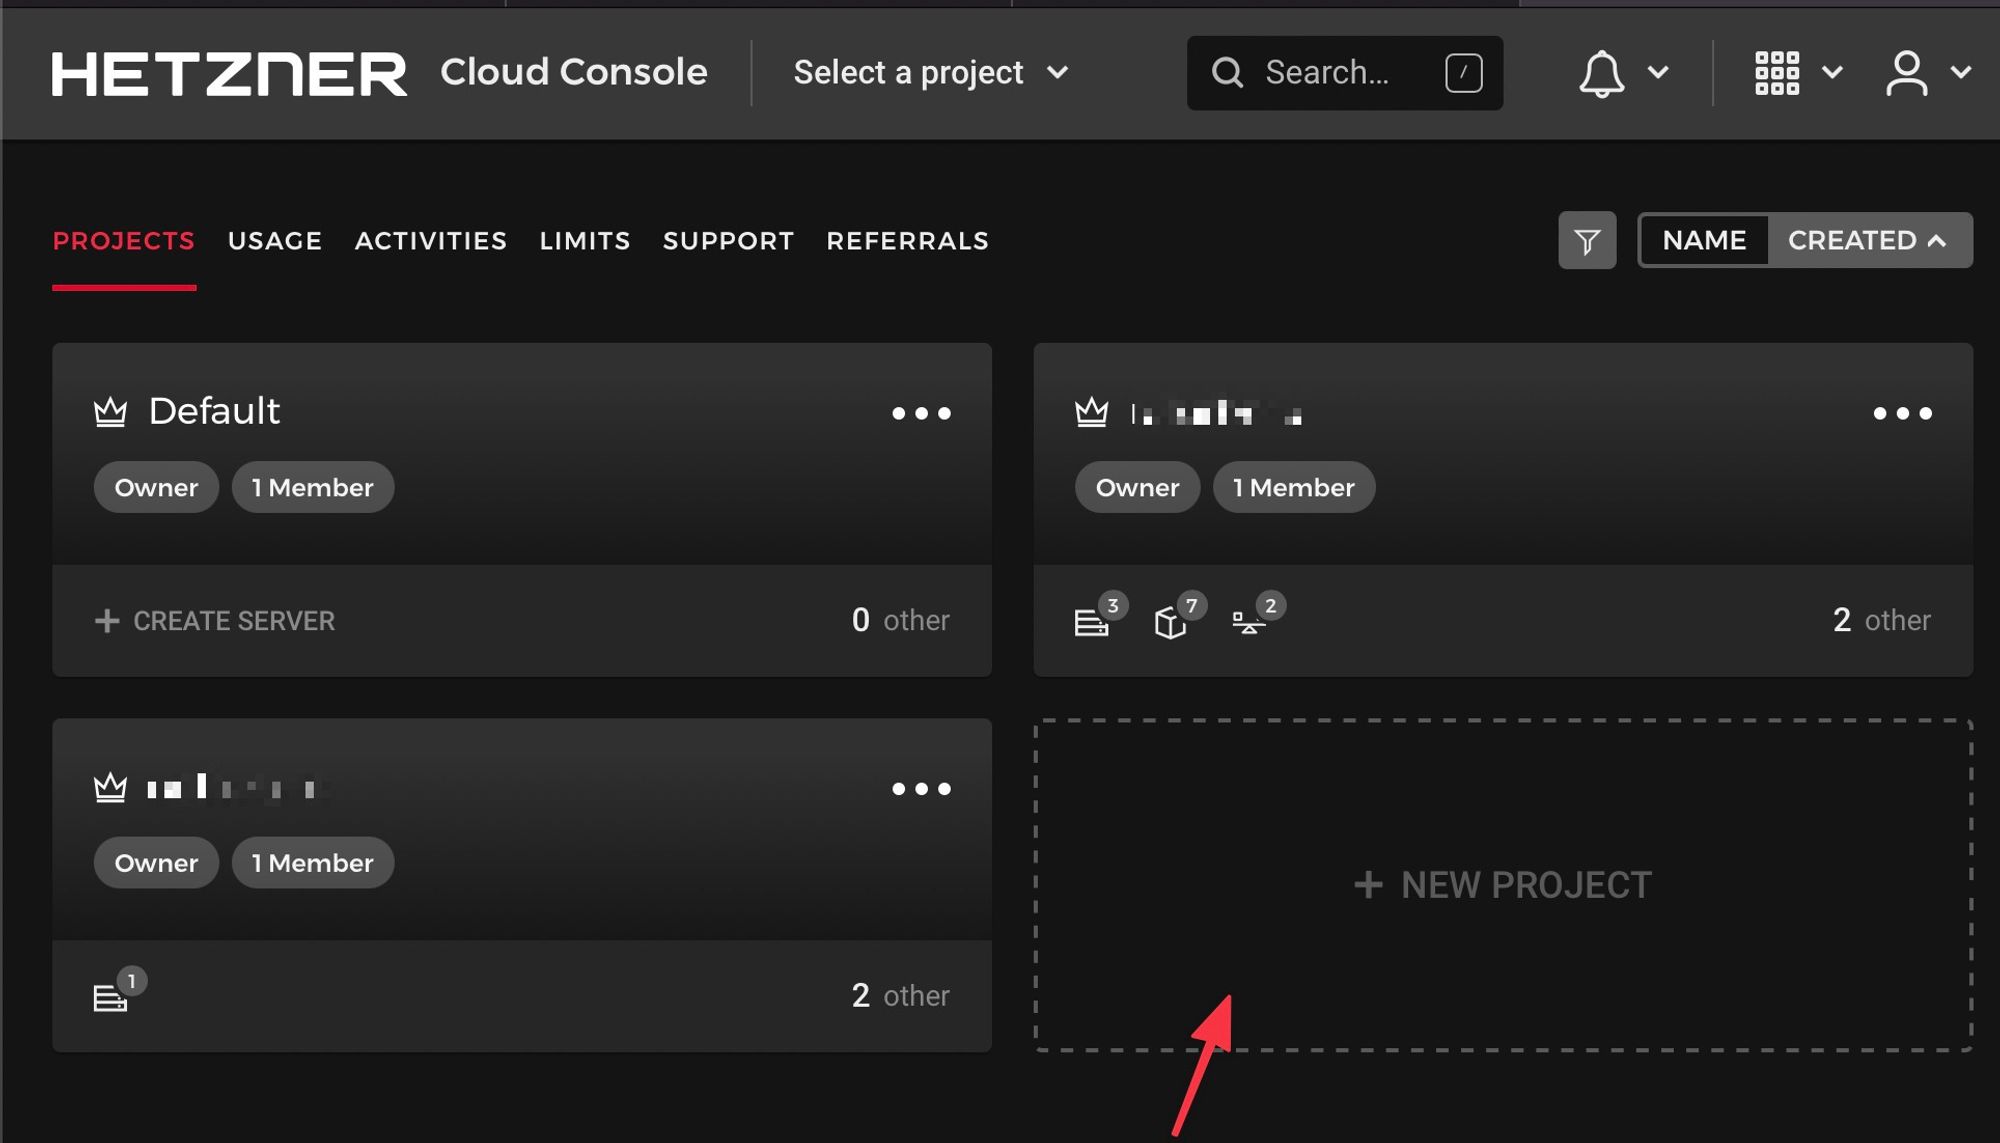
Setting up your Hetzner cloud project
If you don't have a Hetzner Cloud account yet, you can use my link to get 20 euros of free credits.
First, create a Hetzner Cloud project:
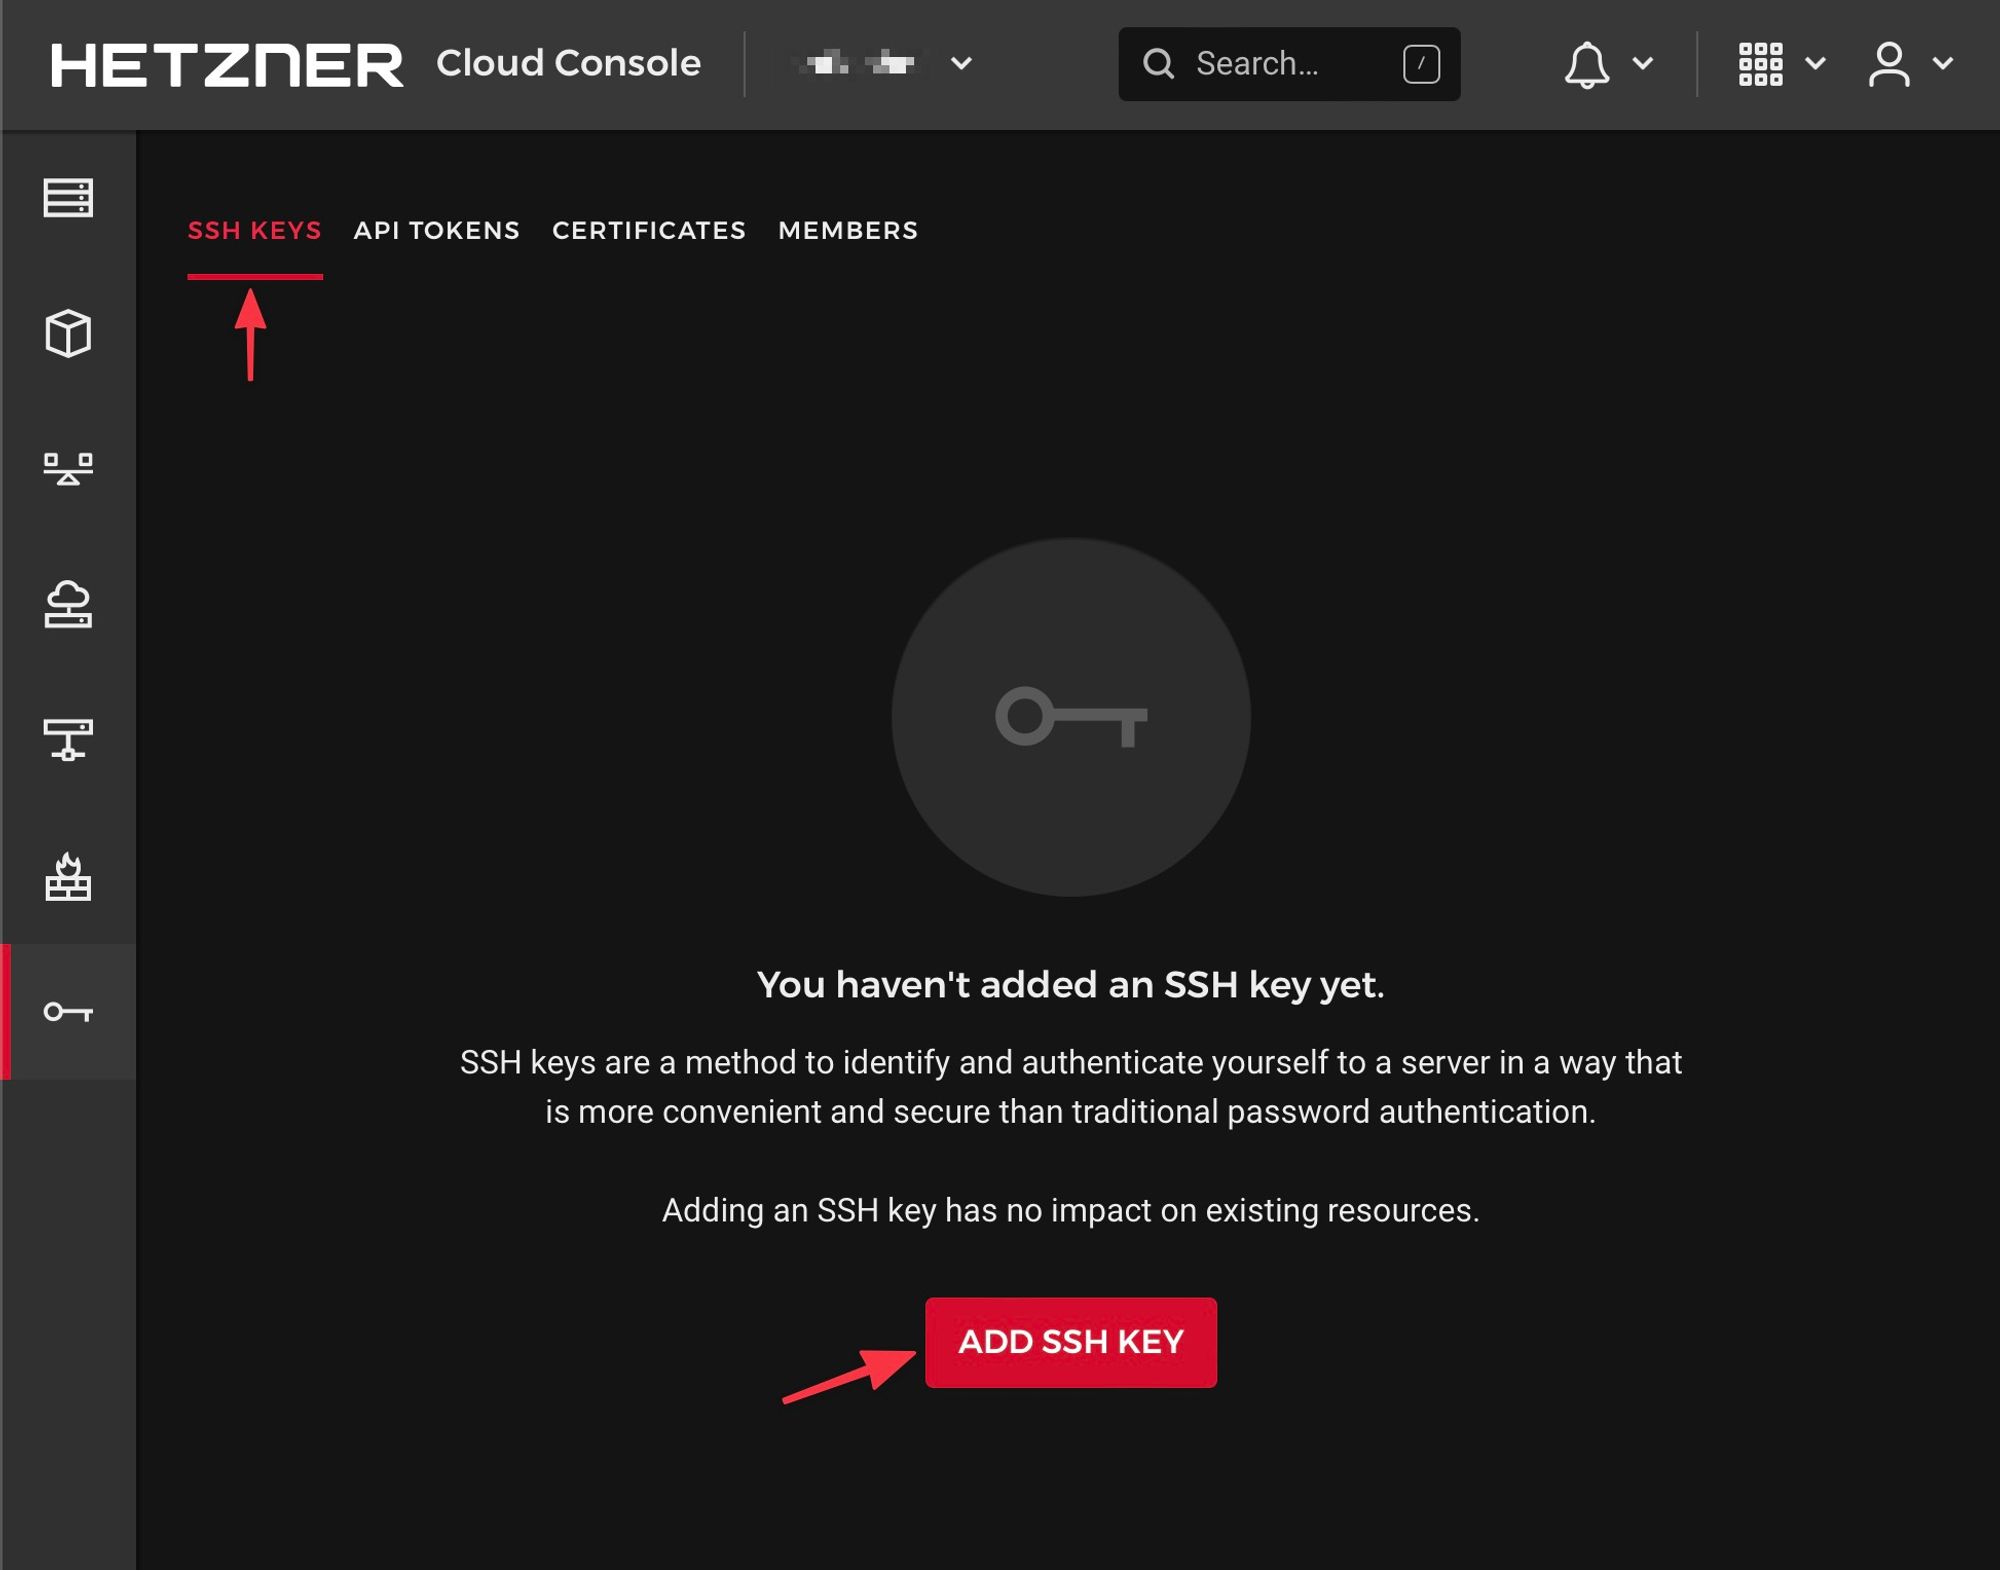
On the security Tab 🗝
Add your SSH key:
And, on the "API Tokens", generate an API Token:
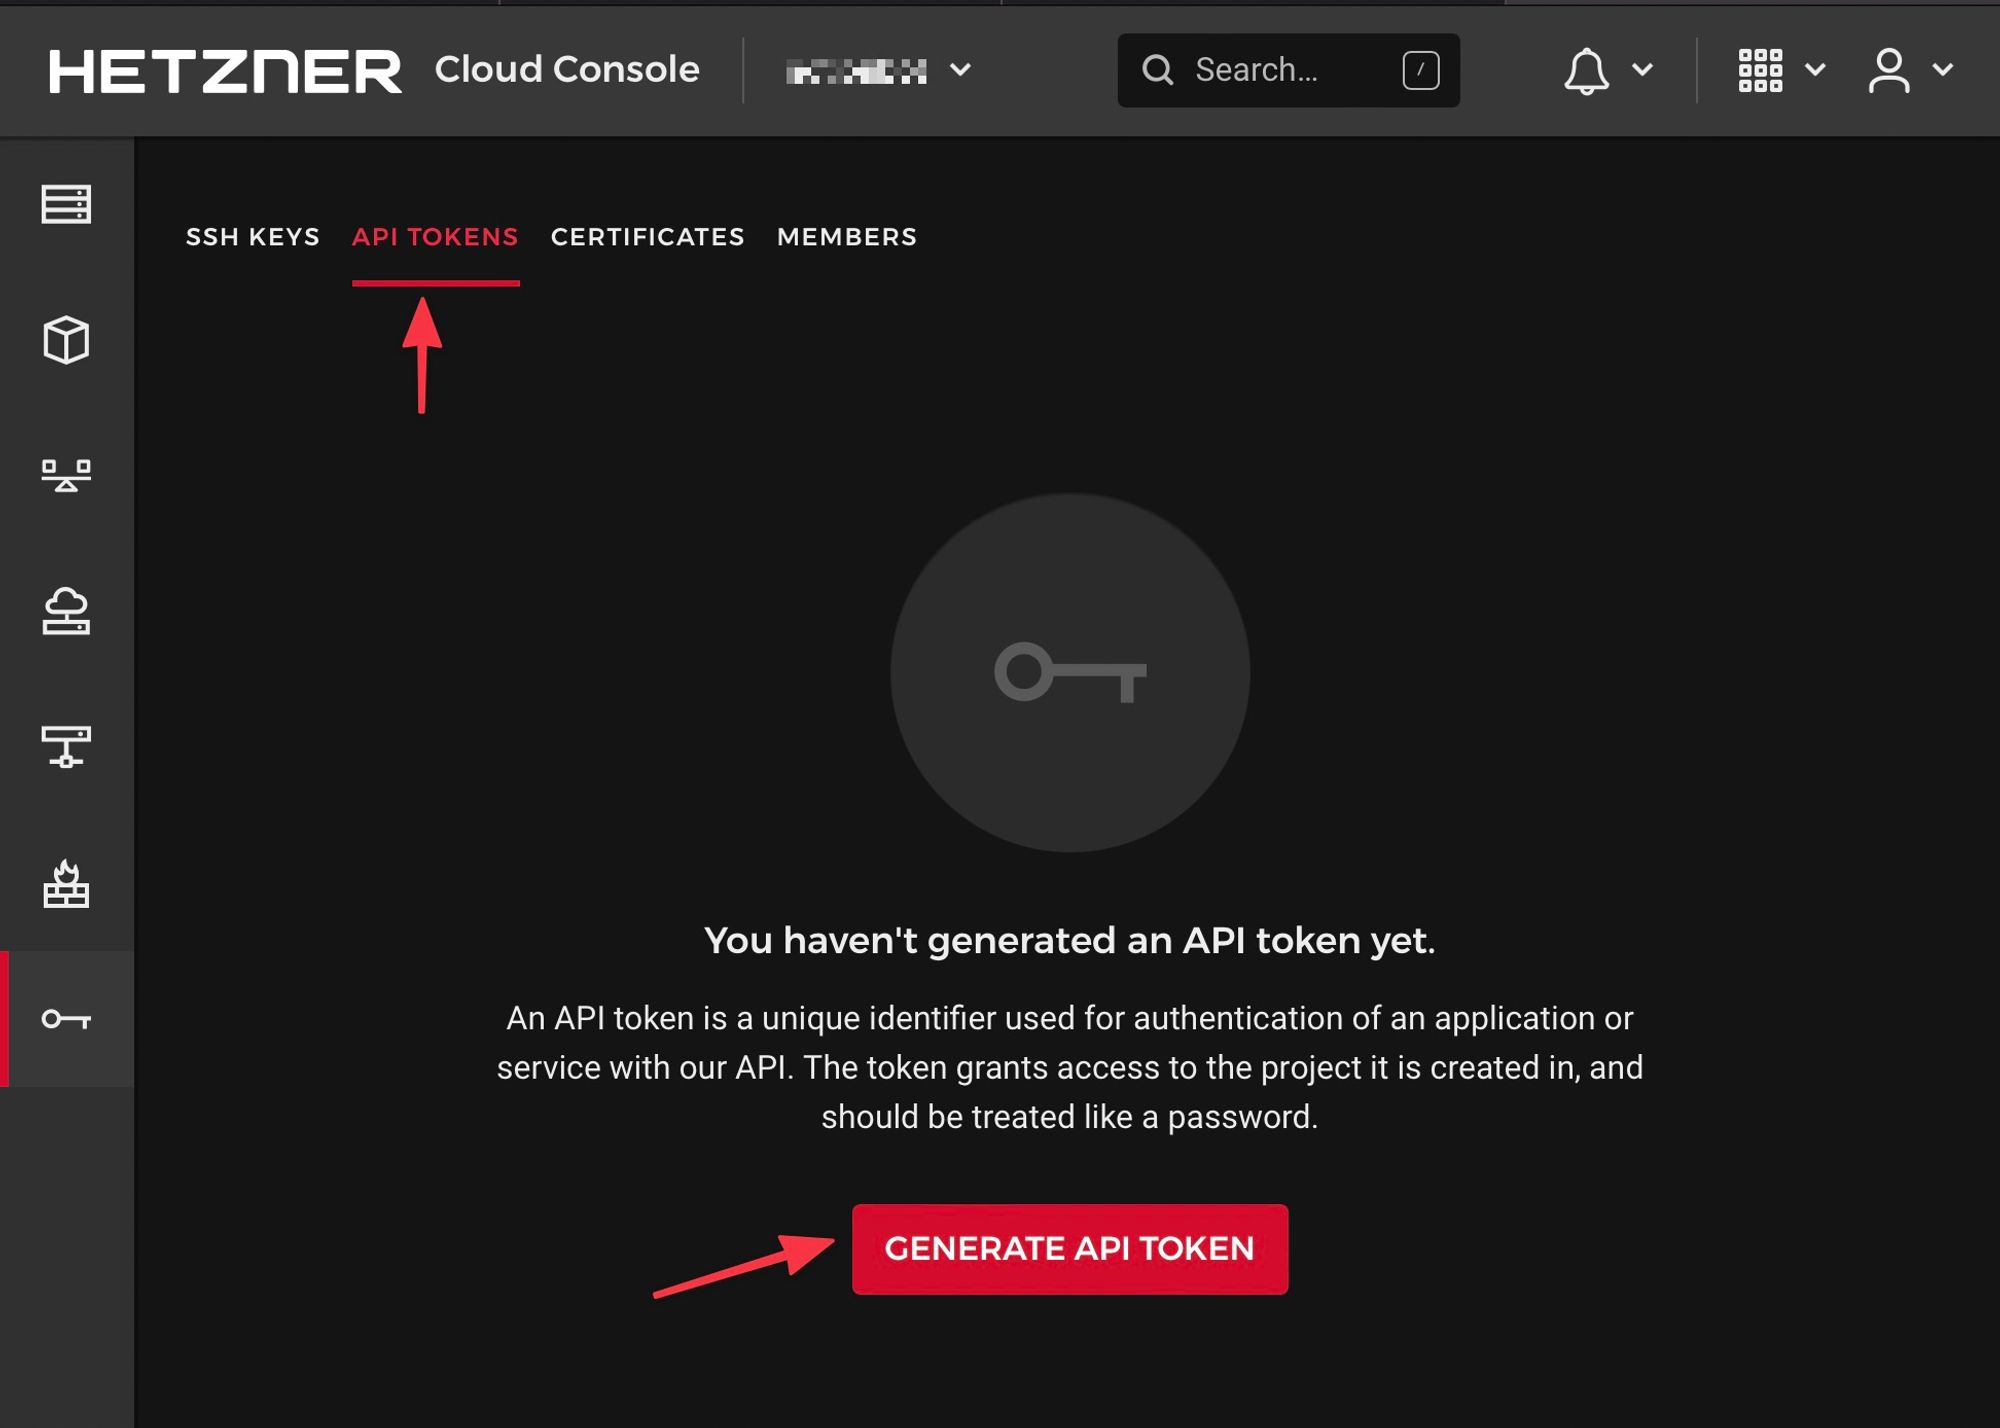
Keep the generated token handy as we will use it on the next steps.
Create the k3s cluster
Create first a working directory:
mkdir k3s
cd k3s
Create a
config.yaml file and add the following, while replacing YOUR-HETZNER-TOKEN and YOUR-CLUSTER-NAME with the correct values.You can edit the number of node pools and instance counts based on your use case:
---
hetzner_token: YOUR-HETZNER-TOKEN
cluster_name: YOUR-CLUSTER-NAME
kubeconfig_path: "/cluster/kubeconfig"
k3s_version: v1.21.3+k3s1
public_ssh_key_path: "~/.ssh/id_rsa.pub"
private_ssh_key_path: "~/.ssh/id_rsa"
ssh_allowed_networks:
  - 0.0.0.0/0
verify_host_key: false
location: fsn1
schedule_workloads_on_masters: false
masters:
  instance_type: cpx11
  instance_count: 1
worker_node_pools:
- name: small
  instance_type: cx41
  instance_count: 3
Now we will run the Magic script (Thanks @vitobotta 🙏) to orchestrate the installation of your cluster.
(Make sure you have docker installed on your computer)
docker run --rm -it -v ${PWD}:/cluster \
-v ${HOME}/.ssh:/tmp/.ssh \
vitobotta/hetzner-k3s:v0.4.8 \
create-cluster --config-file /cluster/config.yaml
Note: We mounted our
~/.ssh folder to use our ssh private key. The script might prompt you to type the passphrase of your ssh key.The script will create the infrastructure for you (servers, private network, firewall, load balancer for the API server for HA clusters).
And will generate a kubeconfig file, that you can use with your
kubectl commands.(Make sure you have
kubectl installed on your computer)On my Mac, I'm using the command to replace the default kubeconfig with this one.
cp ~/.kube/config ~/.kube/config-backup
cp ./kubeconfig ~/.kube/config
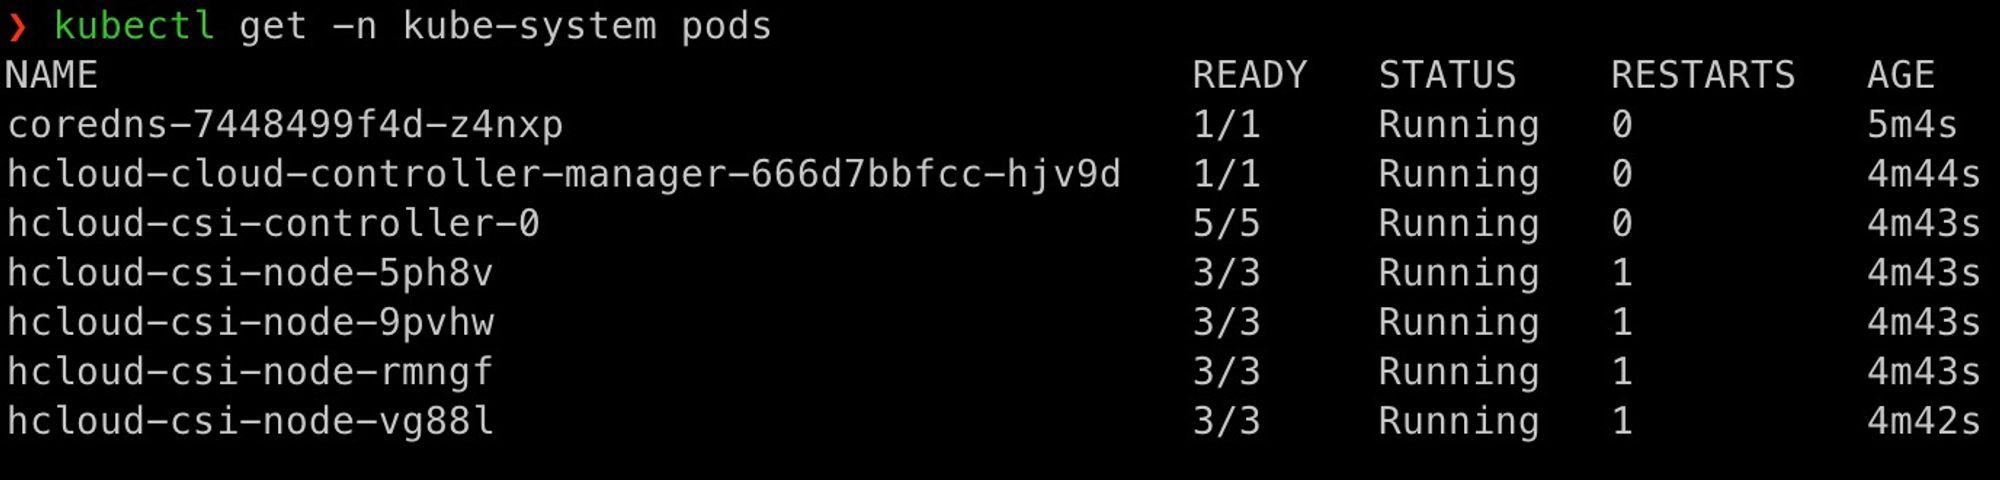
Now your k3s cluster is ready to use, you can test it out:
kubectl get -n kube-system pods
Once the cluster is created you can provision load balancers and persistent volumes out of the box!
Installing Prometheus Grafana Stack for Monitoring
In order to have a visibility on what's happening on your infrastructure, we use Promotheus and Grafana for monitoring.
On your working directory, clone the following repo:
git clone https://github.com/prometheus-operator/kube-prometheus.git
cd kube-prometheus
And run the following commands to quickly install the stack:
kubectl create -f manifests/setup
until kubectl get servicemonitors --all-namespaces ; do date; sleep 1; echo ""; done
kubectl create -f manifests/
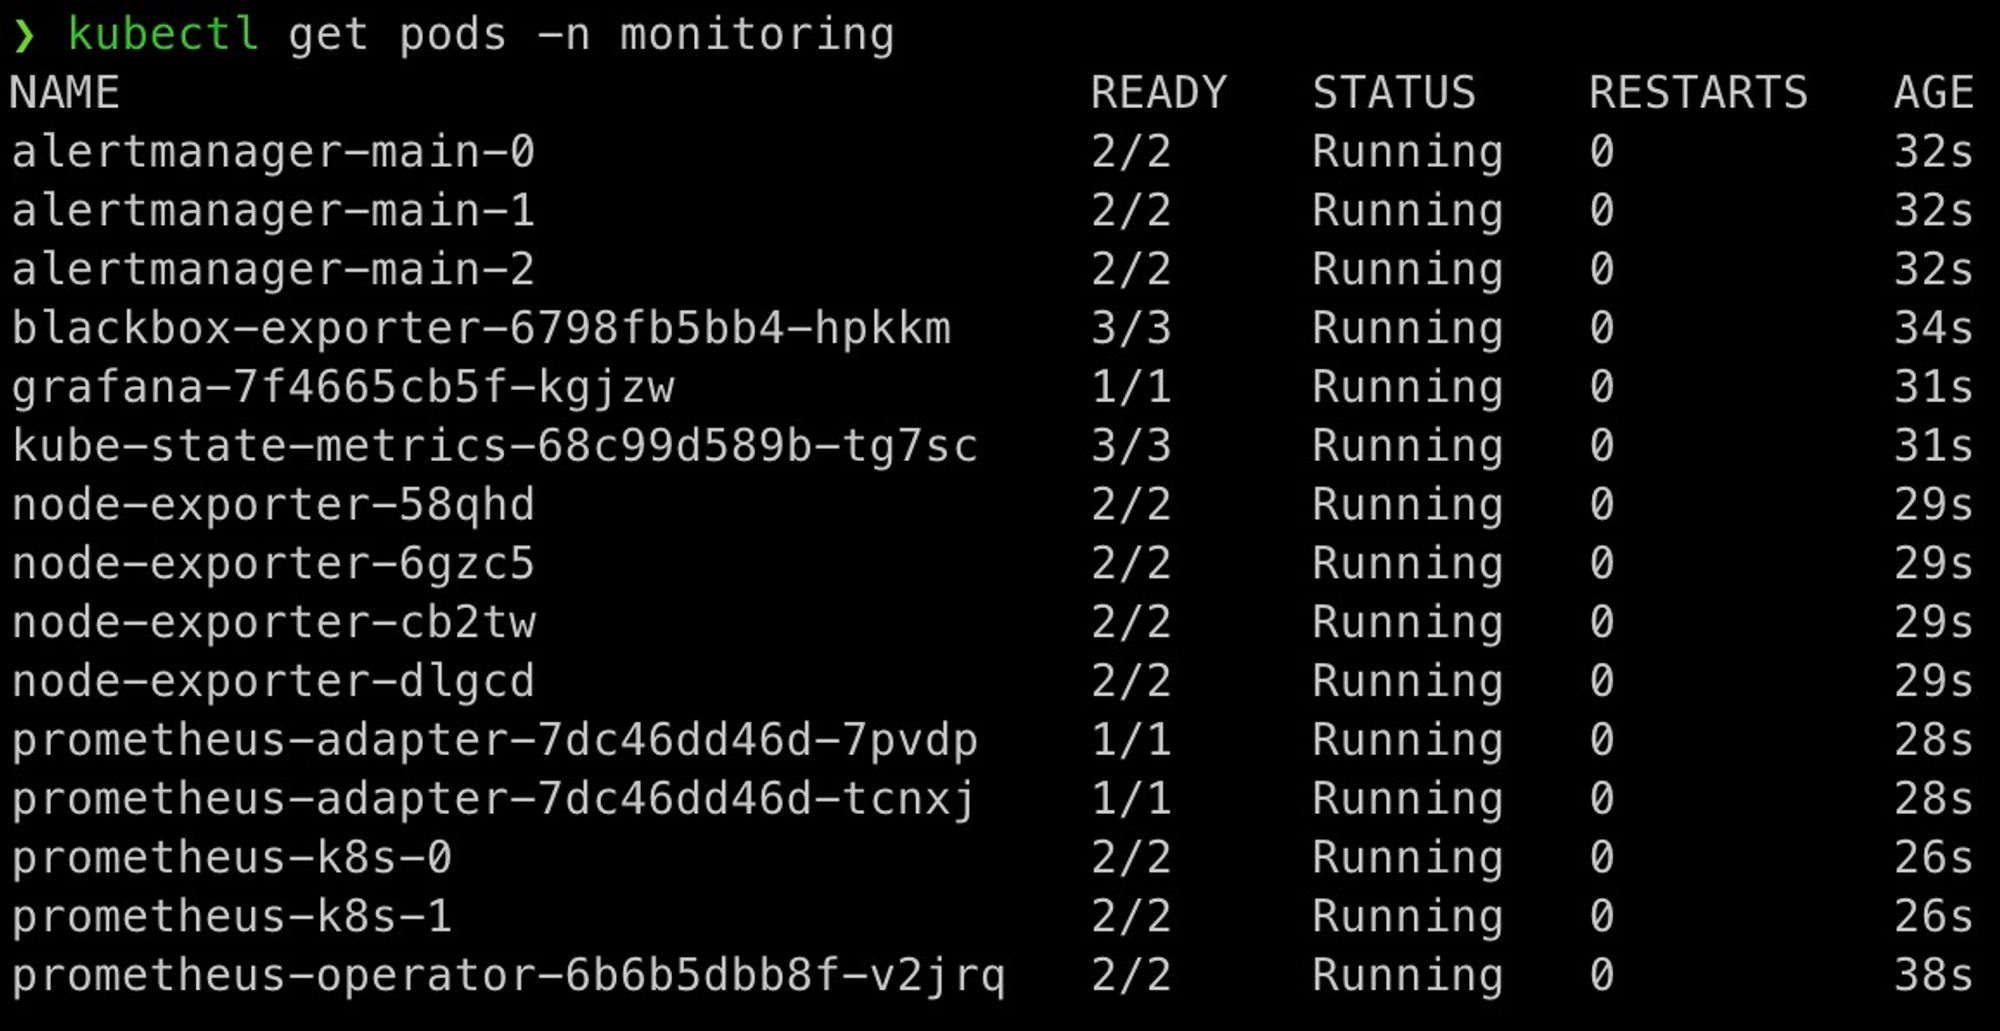
After a moment, you'll have all your services deployed, you can check the status by running the following command:
kubectl get pods -n monitoring
Now your monitoring is ready, and you can access the Grafana dashboard:
kubectl --namespace monitoring port-forward svc/grafana 3000
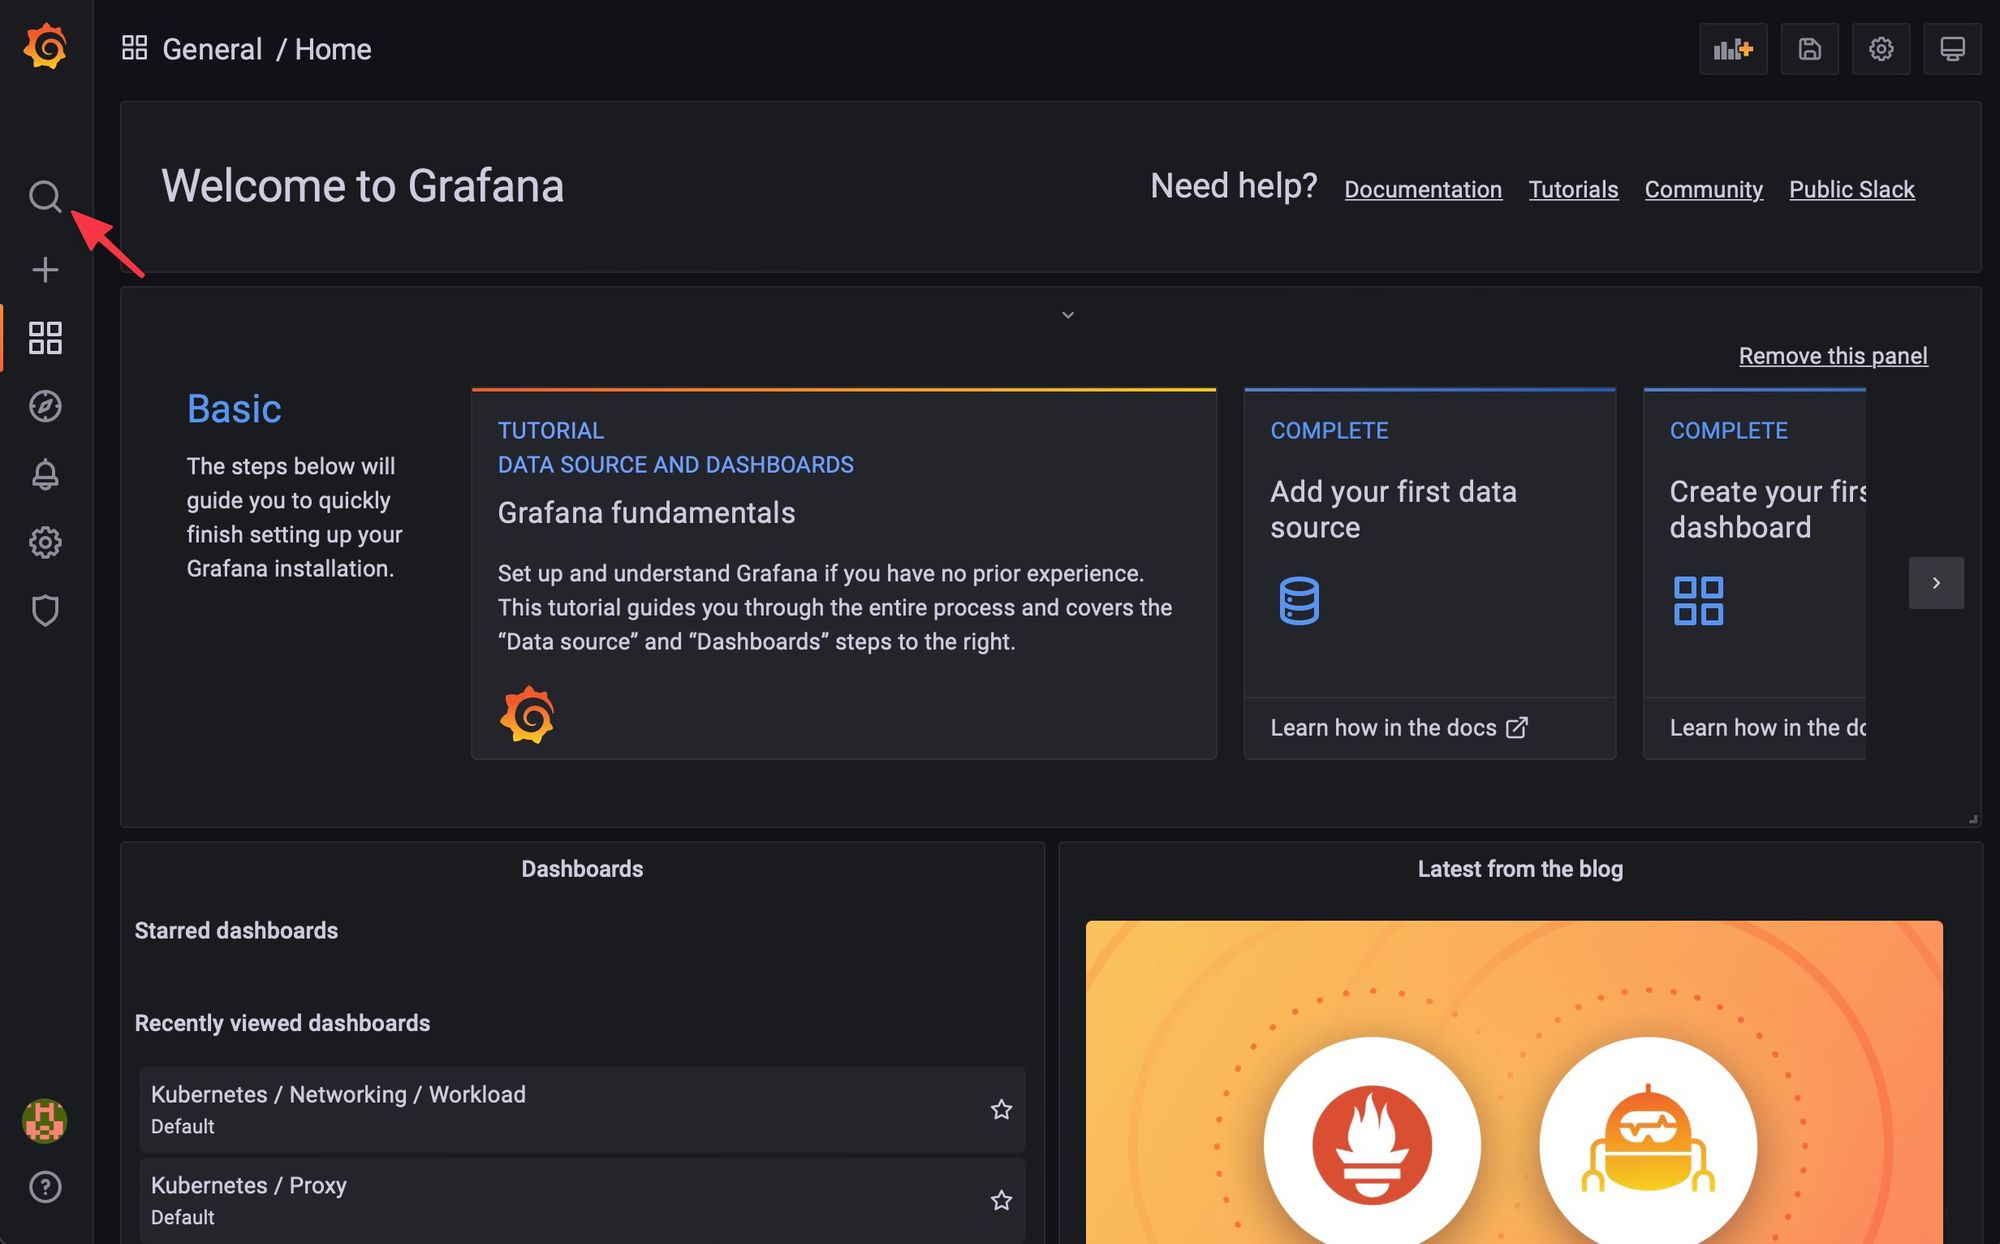
When you go to http://localhost:3000 – the default credentials are admin:admin. The UI will prompt you to change the password afterwards.
You can get started and browse available dashboards:
On the first start, it might take a moment to start seeing metrics as this is a fresh installation.
Conclusion
Now that you have your cluster ready to use, we will cover on the next article how to set up a GitOps workflow with a CI/CD flow (CircleCI, ArgoCD).
This article is brought you by tonoïd – we are a micro-startup studio building small businesses that are profitable and solve a specific problem without any external funding nor billion-dollar market-size. Most notably, RefurbMe, a comparison site for refurbished products – and Notion Automations.
If you have any feedback, do not hesitate to reach out at Contact